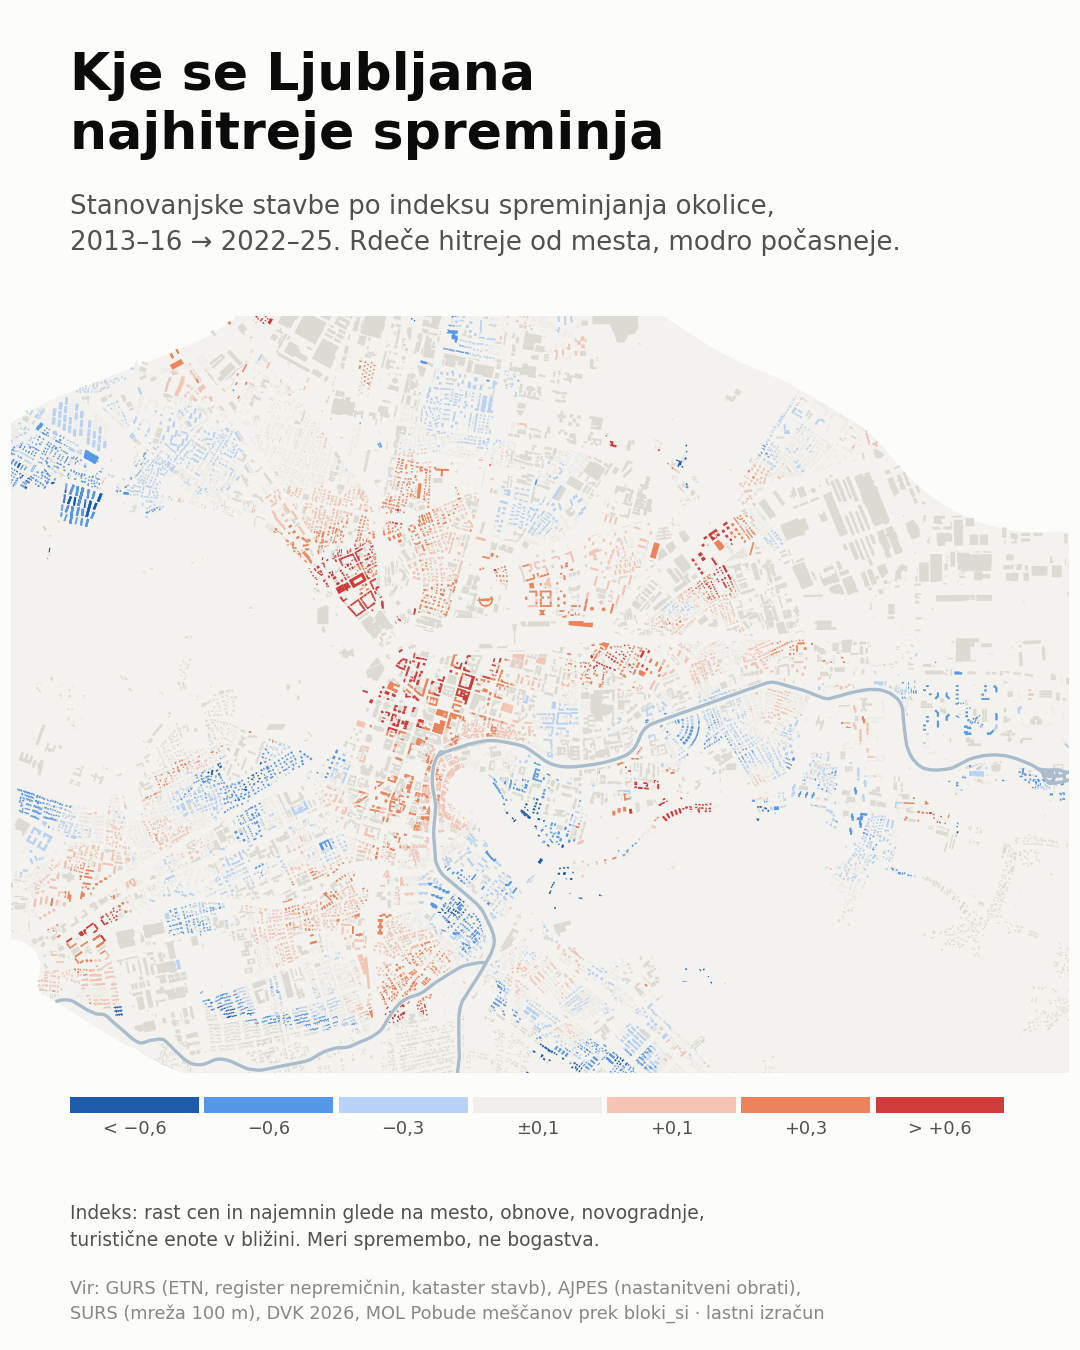
Two Ljubljanas
At building level, price and visitor units move in opposite directions: their correlation is −0.53, and price against renovation −0.29. The centre fills with visitors and renovates while its flat prices fall behind the city. The eastern and southern estates catch up on price with almost no visitor letting.
These are not two stages of one process. They are two processes.

Price is price ÷ GURS generalised value against the city, so the size and age of the flats sold do not move it. Visitor units are today's register, not a change.
Source: GURS, ETN, AJPES, SURS · bloki.si
The districts
Jarše has the highest index, then Center, Šiška and Bežigrad. Dravlje, Šentvid and Polje have the lowest. The components show why: visitor units and renovation in Center, rents and new building in Jarše, and in Polje a price rise that does not lift the index far because little else is changing.

Dwelling-weighted mean per district. Sostro and Šmarna gora are left out: too few flats for a reliable price.
Source: GURS, ETN, AJPES, SURS · bloki.si
Cheap and fast
Gentrification in the narrow sense needs both: the surroundings started cheaper than the city, and they are changing fast. That holds for 13,129 dwellings, 13% of those that can be classed. A further 24% started dear and are changing fast, 36% started cheap and are slow, and 28% started dear and are slow.

The start is the 2013–16 price per m² against the city; fast is the top quarter of the index.
Source: GURS, ETN, AJPES, SURS · bloki.si
The map: look for yourself
The same data, flat. Pick a component; zoom with Ctrl and the wheel or with two fingers, drag to pan (two fingers on a phone). Buildings cannot be searched by address: the colour describes the surroundings, not the building or the people in it.

Who lives there
From the slowest to the fastest tenth of buildings, the share of residents within 300 m with tertiary education rises from 38.9% to 44.0%, the share aged 25–39 from 17.6% to 20.8%, and the share aged 65 and over falls from 22.1% to 17.4%.
This is today's population, not a change. The SURS grid is one snapshot, so it cannot say who arrived and who left.

Residents are today's population (100 m grid), not a change: the grid does not say who arrived and who left. Education only where SURS publishes it.
Source: GURS, ETN, AJPES, SURS · bloki.si
The 2026 vote by speed of change
We split the polling catchments into five equal groups by the index of the buildings in them. From the slowest to the fastest fifth, Levica in Vesna's share rises from 10.6% to 14.2%. Svoboda (32.9% → 31.7%), SDS (19.6% → 18.1%) and NSi–SLS–Fokus (7.1% → 6.4%) barely move. The index correlates 0.20 with the left bloc's share: a modest gradient for one party and none for the others.
An area's vote, never a resident's: an ecological association, not a cause. The 2026 national election, not a local one. Only catchments with at least 300 valid votes and a score for at least half their addresses; early and postal votes excluded.

Source: GURS, ETN, AJPES, SURS · bloki.si
Citizens' filings
In the fastest-changing fifth, filings about public order rose from 90 (2016–19) to 150 (2020–23); in the slowest they stayed small (14 and 11). Filings about noise near a venue went from 13 to 36 in the fastest fifth, which is a small count.

The filing rate rises with price and centrality anyway. The windows stop before 2024, when filings fell 38% in every category. Filings on shared pins (the town hall) are excluded.
Source: GURS, ETN, AJPES, SURS · bloki.si
§ How it is calculated
Five components. Price: sales of flats in buildings built before 2008, as price ÷ GURS generalised value, against the city median of the year; 2022–25 over 2013–16, within 600 m and with at least 30 sales in each window. The GURS value holds size, age and quality fixed, so a window that happened to sell larger or newer flats does not read as a rise. Rent: rent per m² against the city and the size band, 2021–24 over 2013–16, within 600 m. Renovation: the share of residential buildings built before 2005 with a facade, window, roof or installation renovation dated 2014 or later, within 300 m. New building: the share of dwellings in buildings built 2014 or later, within 300 m. Visitor units: apartments, rooms and holiday homes (no hotels or hostels) per 100 dwellings within 300 m, today.
Weights. Each component is a dwelling-weighted z-score clipped at ±3; the index is their weighted mean. Rent has half weight, because its split-half reliability is 0.51 against 0.80 for price. The other weights are equal, because there is no measure of "true" gentrification to fit them to.
What the index does not say. Rent can still carry a change of mix (age, quality). The renovation years in GURS are what owners report. The visitor-unit register began in December 2017, so visitor units are a level and not a change. The election results are national; local results are not loaded.
Can the Bloki server answer questions like these?
This analysis was run once, for the whole city, and is not served as a tool. Many of its parts, though, are available for any address through the MCP server:
- No
Is my neighbourhood gentrifying? What index does my building have?
The index is not served, and will not be served by address: a red building would read as a verdict on the people living in it.
data_limitations - Yes
How have prices and rents moved in my district?
Median sales and lettings by period for a municipality or district, with n and spread; a price index for a municipality.
market_statsprice_indexasking_prices - Yes
How many visitor units are around this address?
Registered short-term units per 100 dwellings over the same radius, beside occupancy (residents per dwelling).
neighbourhood - Partly
What is being built and renovated nearby?
Building permits within a radius, and one building's renovation years. It does not compute the share of renovated buildings around an address.
building_permitsget_property - Partly
Who lives around this address?
Residents, children under 15 and people over 64 within 500 m and 1 km. Education and the 25–39 age band are not served.
neighbourhood - Partly
How did the area around this address vote?
The polling catchment's lean relative to the national result, with left/right shares and the number of votes. Not by party.
neighbourhood - No
Is it noisy here? What do the neighbours write in their filings?
The server says how many filings there are nearby and of which kinds (Ljubljana only). No source holds a sound level, and the filings' text is never served.
neighbourhooddata_limitations